

Knowledge Base & Support
TOPICS
Georeferencing
The Georeferencing job allows you to transform your registered data into a coordinate space by picking known targets in the scene. This can be for placing the data where it fits in the real world or transforming the data from an arbitrary local system to a site grid system. Often these targets have been measured, as part of a survey, with a total station or similar device.
Job Creation
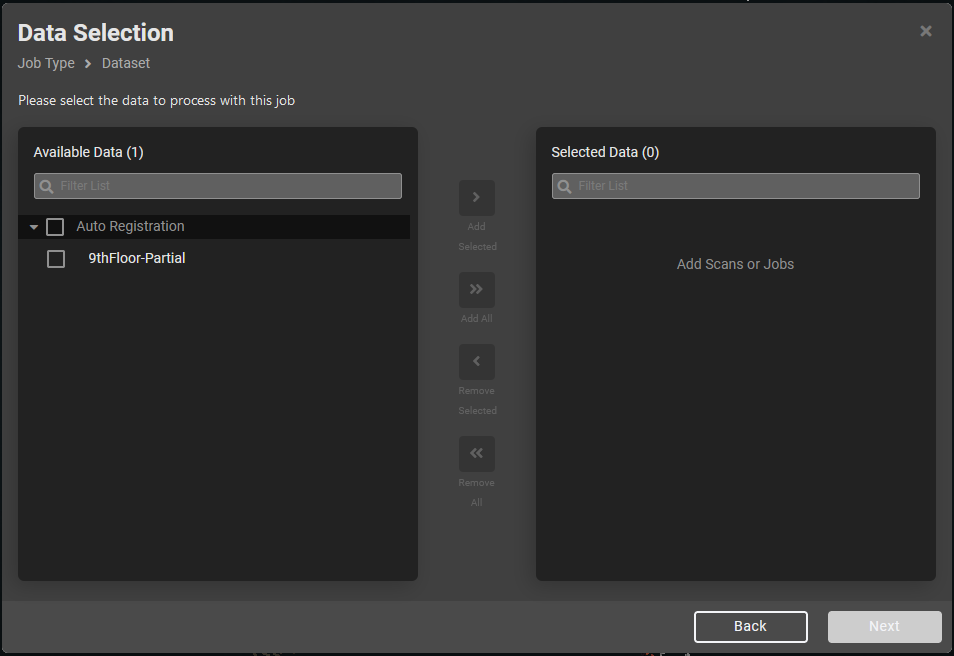
- From the Create New Job menu select Georeferencing
- Select the registration job to be included on the left hand side with the checkboxes and choose ‘Add Selected’. Then press ‘Next’.
- Either auto, manual or optimise registration result can be used as input.
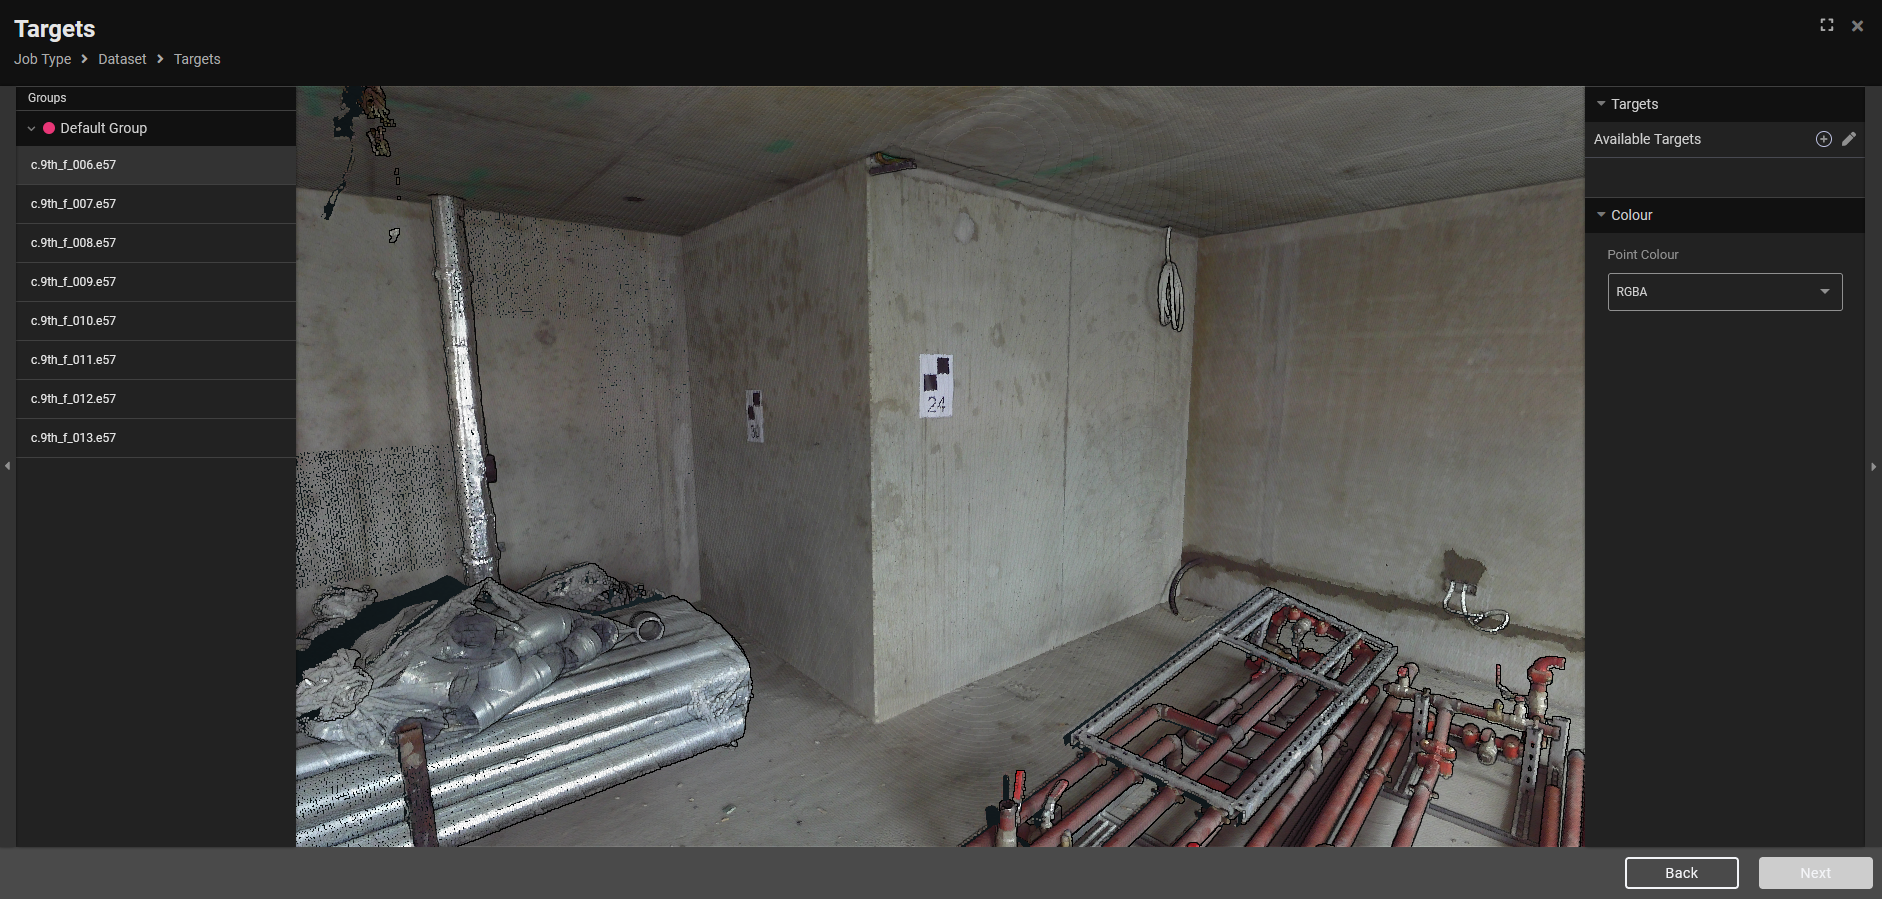
- Once the data is chosen and you click Next then you get to the target picking interface as shown below. This is made up of a list of scans to select from on the left, the scan view in the centre and the target list on the right.
- You can click and drag to move the 3D view position around the fixed point. If the view point is not optimal for target selection, use the arrow keys on the keyboard to move the camera location as if you are walking around the scene.

Add Targets
- First add your coordinated targets to the target list by clicking the plus icon. This will bring up the window to manually add your target data, as below:
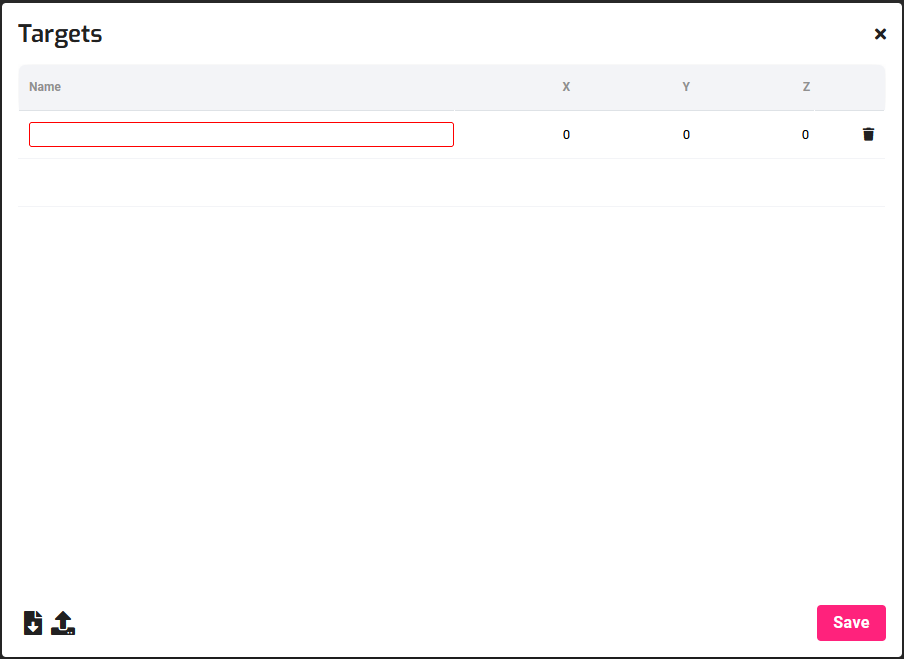

- Targets can be imported from a CSV by clicking on the upload icon:
- The csv must be comma delimited with header row on the first line as below, then data on each line after, e.g.:
Name,X,Y,Z
T1,24.02,10.23,6.98
T2,35.03,11.63,6.44
- The csv must be comma delimited with header row on the first line as below, then data on each line after, e.g.:
- Once your target data is added, select a scan that the target appears in from the left sidebar, then select the target name from the right sidebar. Move the 3D view as appropriate to find the target and double-click the left mouse button to select the target. A red ball will appear on the place selected. See the video below for an example:
- At least 3 targets need to be placed across the data and all targets added to the job must be placed before you can continue.
Result
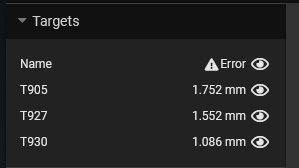
- The results screen shows the error of the placement of the targets picked in the scans against the target coordinates provided. These appear on the right sidebar as below:

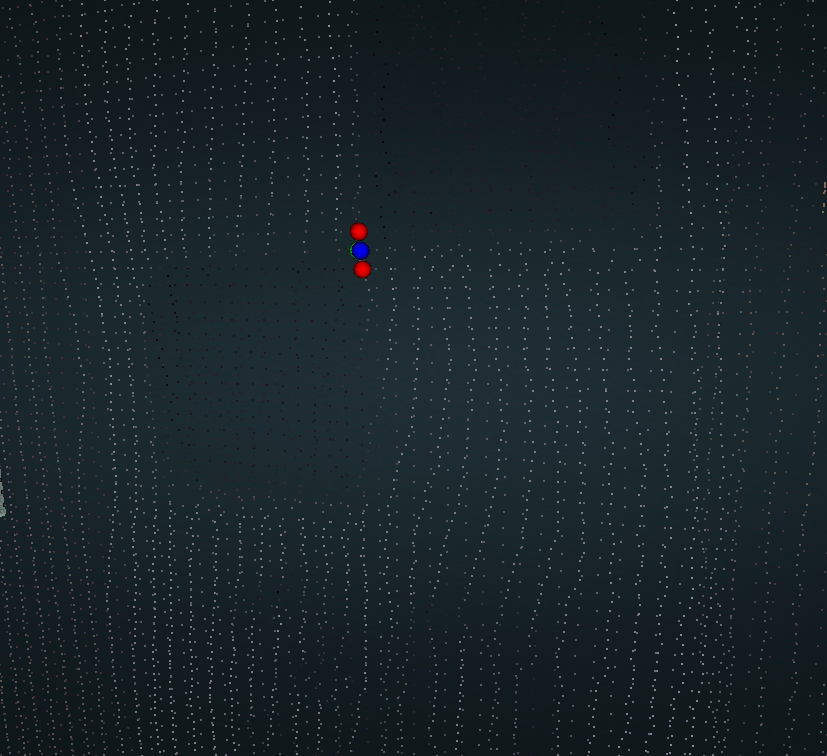
- The 3D view in the centre of the screen shows the registered scan data along with the target data represented as red, green and blue spheres. In an ideal case, they would all be positioned on top of each other.
- Red represents the manual target picks in each scan
- Blue represents the average of the picked positions if the same target was picked in multiple scans
- Green represents the coordinate positions of the targets that the user provided
- So, the error can be visualised as the distance between the blue and green spheres per target.
- The image below shows a close up of a target with the red target picks spread, the blue averaged position from the red picks and, close by the blue, the green actual position from the given coordinates.

- Finally, click Create to save the job to the project explorer. The statistics will appear in the right side bar and you will be able to continue to view the result from the project.
- This result can then be exported in the new coordinate system that was applied.
Georeferencing Error Report
Once created, you can view a full breakdown of the statistics of the georeferencing in the job report.
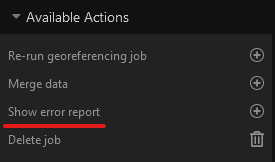
To access the report, choose Show error report from the right sidebar for the Georeferencing job.
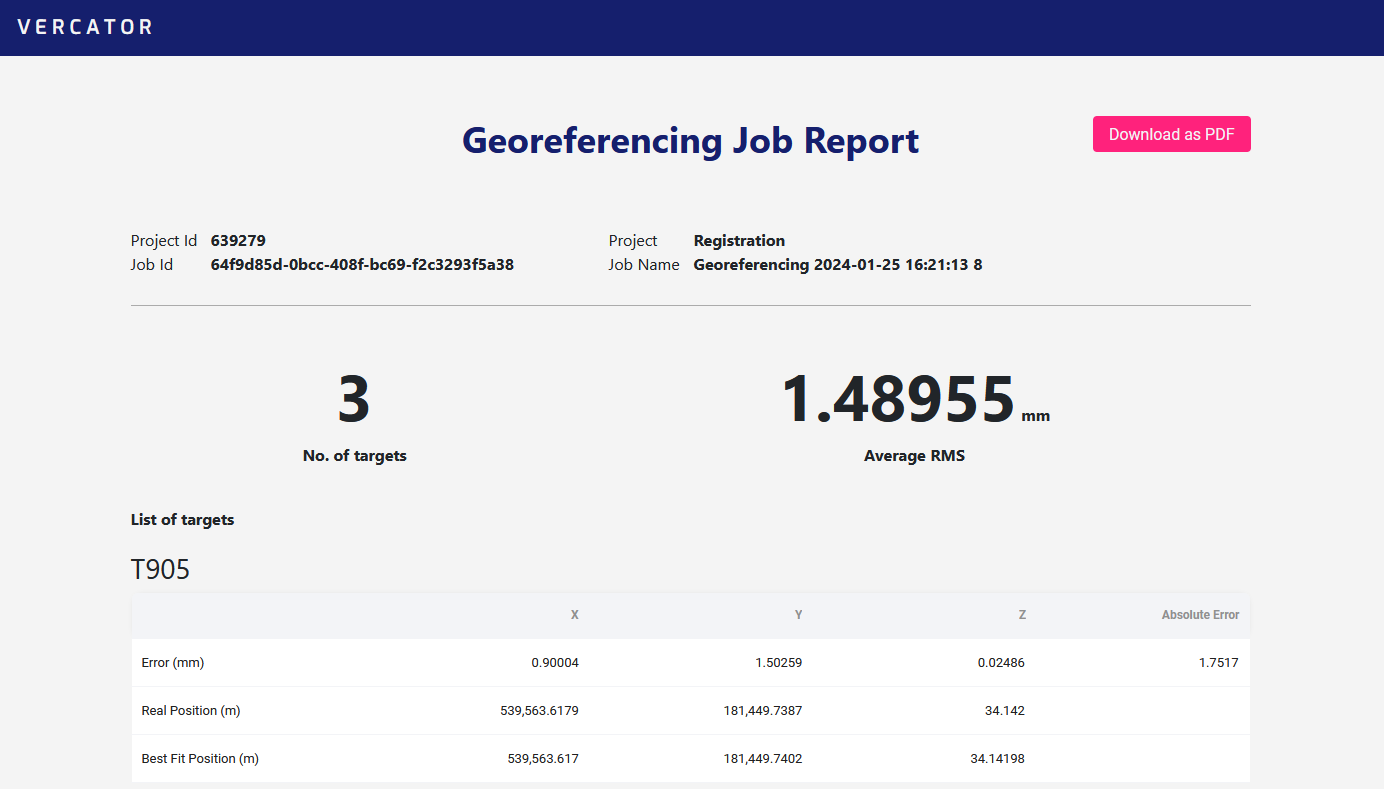
This will open the report in a new window. This report can be downloaded as a pdf, you can view a sample report here.
The report is broken down into some top level details such as overall average accuracy (RMS) and number of targets, then a list of the target positions, calculated positions and individual errors for traceability.
Export
The result can be exported unstructured by first running a merge or, if the data is supported, it can be exported as structured data as described here.